
Website analytics – The must-have tool for site owners
This website uses multiple services and scripts to gather statistics of site usage and traffic. For any webmaster, such statistics are not just interesting to view but pretty much essential to keep websites working as good as possible. The main service for the most complete and detailed stats is Google Analytics, which is an external statistics system that runs on Google servers. I am also using a secondary statistics system which is running as a set of scripts on this server, called Mint.
This is a good combination in my opinion, as Google Analytics provides very detailed data and the possibility to generate reports and see changes for any set of data over time. When I need to know how the number of pages each visitor views in average in a day has changed over the last 6 months, Analytics makes it easy to find the answer. But Google Analytics has one weak point: It lacks a simple overview of the most important information regarding what is happening on the site at any given time. That is where Mint becomes useful, as it displays everything I need to know on one single page where I can get a quick update on the numbers for the last 24 hours, along with a summary of the number of unique and total visitors per week and per month for the last 12 months.
This is what Mint looks like:

Up until recently, I also used a third statistics service to get access to real-time reporting: Clicky Web Analytics. Clicky has a feature that shows the number of visitors that are currently viewing the site, which pages that are viewed and where in the world the visitors come from. It also shows which page each visitor arrives to, making it easy to see which pages and blog posts that the visitors of the site are finding interesting, again – in real-time.
Google Analytics goes real-time
However since the new design was launched on January 1st, I am no longer using Clicky. A few months ago Google Analytics added a new feature (in beta) for viewing real-time actions on websites, and it works very well. Since Google Analytics is a free service, I do no longer see the need to pay for the commercial service that Clicky is. But it must be said that Clicky is an excellent alternative to Google Analytics, so it is really a matter of taste which one is used. I decided to continue using Analytics since I have been using it for several years, giving me a lot more historical data than I have got from the one year that I used Clicky.
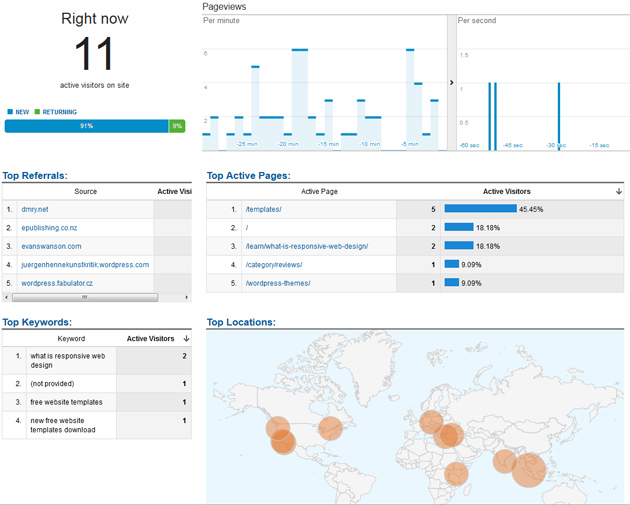
This is what the Google Analytics real-time mode can look like:

This view shows the number of currently active visitors on the site, as well as which websites or search engine terms the visitors came from and which pages and posts that are viewed. Finally, the map shows where in the world the visitors (or rather their ISPs) are located.
Using this knowledge to improve the site
With access to this kind of information, it becomes a lot easier to optimize and improve the site and the visitor experience. Combined with regular Analytics reports are added (for example showing the most common screen resolutions, common entry and exit points, time spent on the site and detailed information on traffic sources), this is a tool which is absolutely essential to my work.
I recommend everyone who is building websites to use a statistics service that provides this kind of information. It can help you improve your website in a number of ways, by simply letting you know how the visitors of your site interacts with it.
If you would want to know more about using website usage statistics and analytics to improve your website, feel free to post questions as comments to this post and I will do my best to answer them.
This article was written by Andreas Viklund
Web designer, writer and the creative engine behind this website. Author of most of the free website templates, along with some of the WordPress themes.